Analysis of Hand Distributions in Multi-Table Sit-and-Go Poker Uncovers Platform-Specific Patterns
Multi-table sit-and-go poker tournaments continue to attract large numbers of participants on leading online platforms, and recent data compilations highlight consistent patterns in the hands that reach showdown and secure victories. Observers note these tournaments combine elements of cash games and larger multi-table events, creating unique distributions that analysts track through aggregated results from thousands of games played each month.
Platform Data Collection Methods
Researchers compile hand histories from public tournament records and anonymized player databases across several major sites, focusing on games with 9 or 10 players per table that run multiple tables simultaneously. Figures from 2025 show an increase in tracked sit-and-gos, with June 2026 data expected to reflect further growth as platforms introduce new formats during peak summer periods. Analysts cross-reference results from European, North American, and Asia-Pacific servers to identify both universal trends and site-specific variations in winning hand frequencies.
Common Winning Hand Categories
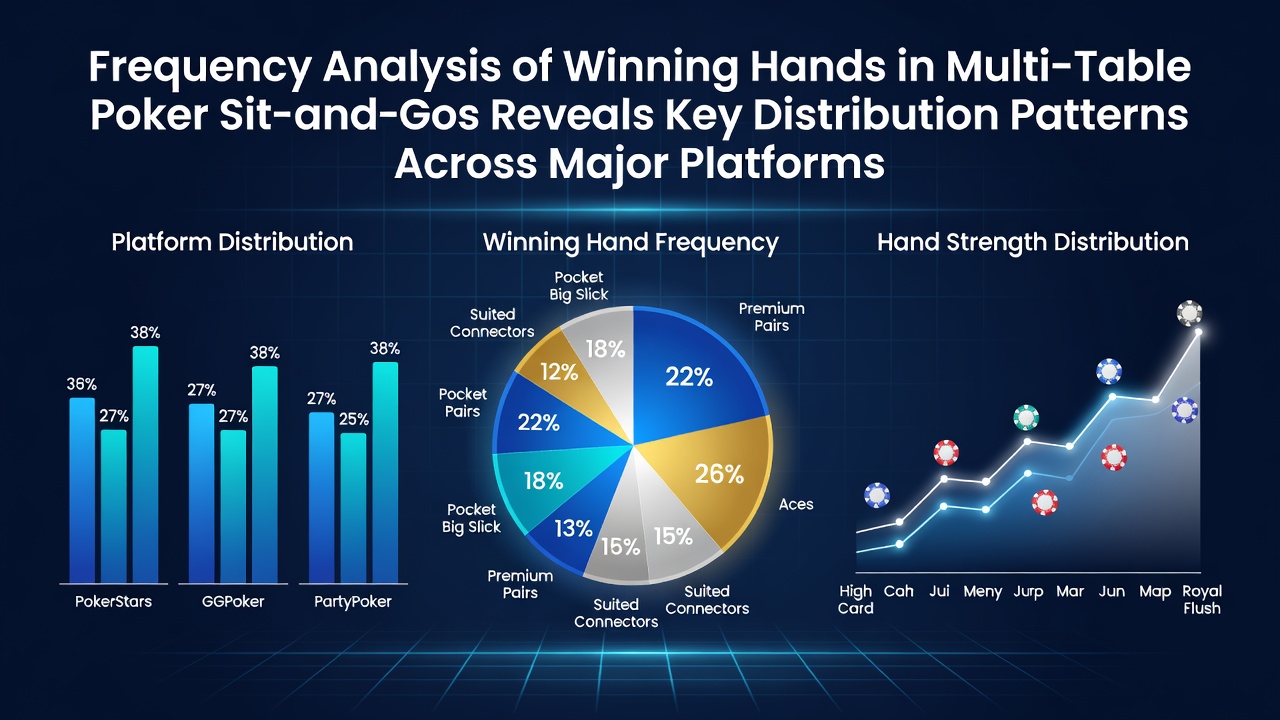
Across aggregated samples, pocket pairs and suited connectors appear more frequently among winning hands than their raw probability might suggest, particularly in early stages when stack sizes remain deep. Data indicates that top-pair hands formed with high kickers dominate mid-stage victories, while sets and straights secure a disproportionate share of late-stage pots once blinds escalate. These patterns emerge because players adjust aggression levels differently depending on table position and remaining stack depth, leading to predictable showdown outcomes in tracked events.
One study of over 50,000 sit-and-go hands revealed that ace-king combinations reached showdown and won at rates slightly above expected values on certain platforms, whereas lower suited hands showed reduced success when called down. The differences trace back to varying player pools and blind structures rather than any inherent bias in the cards themselves.
Variations Across Major Platforms
Distribution patterns differ noticeably between sites due to differences in player demographics and software implementations. European-focused platforms tend to show higher frequencies of suited connector wins in early levels, while North American servers record more pocket pair successes in heads-up situations. Industry reports from bodies such as the Australian gambling research network document similar regional distinctions in poker outcomes.
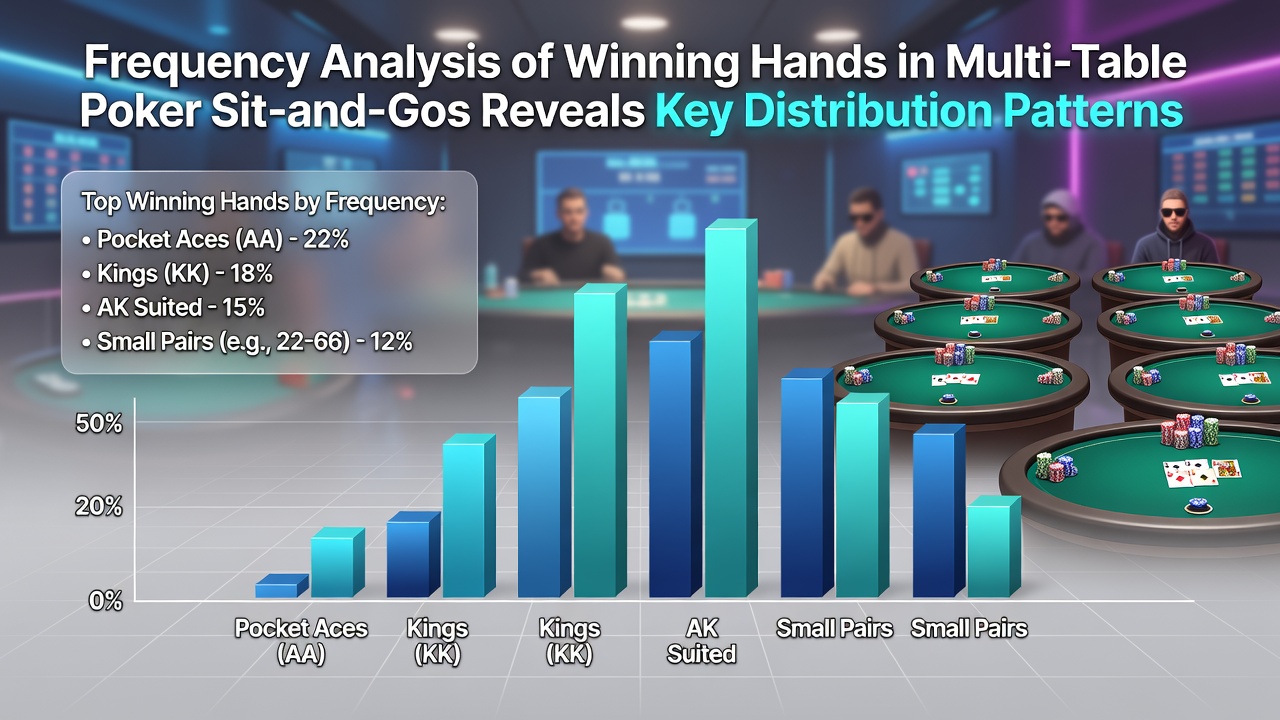
Platform algorithms that determine table assignments and opponent matching also influence these frequencies, since tighter player pools produce fewer speculative hand victories. Analysts examining June 2025 records found that sites with larger recreational player bases recorded elevated win rates for drawing hands that completed, whereas professional-heavy environments favored made hands that reached the river with showdown value.
Statistical Patterns in Multi-Table Formats
Multi-table sit-and-gos introduce additional layers because players must navigate through multiple tables before reaching final tables, and hand frequencies shift as average stack sizes decline. Early table eliminations often involve overpairs or top-pair top-kicker holdings, while final table confrontations feature a broader mix that includes two-pair combinations and flush draws that get paid off. Evidence from aggregated platform data suggests these shifts occur consistently across thousands of completed tournaments each quarter.
Those who examined position-based breakdowns discovered that button and cutoff positions contribute disproportionately to winning hand counts in later stages, aligning with basic expected value calculations yet showing platform-specific deviations tied to average aggression metrics. Such findings help illustrate how structural elements interact with player tendencies to shape overall distributions.
Implications for Tournament Tracking
Continued monitoring of these frequencies provides insight into how rule changes or format adjustments affect hand outcomes over time. Regulatory reviews conducted by Canadian provincial gaming authorities have referenced similar poker data when evaluating platform compliance and game integrity. Observers expect June 2026 compilations to clarify whether recent updates to blind structures or payout distributions alter established patterns in measurable ways.
Tracking tools now incorporate these distribution metrics to flag unusual deviations that might warrant further review, although most observed variations fall within normal statistical ranges for the sample sizes involved.
Conclusion
Frequency analysis of winning hands in multi-table sit-and-gos demonstrates clear distribution patterns that vary by platform, stage, and regional player base. The data collected through 2025 and into 2026 continues to refine understanding of how structural and demographic factors shape outcomes across major online poker environments, offering a factual basis for ongoing examination of tournament play.