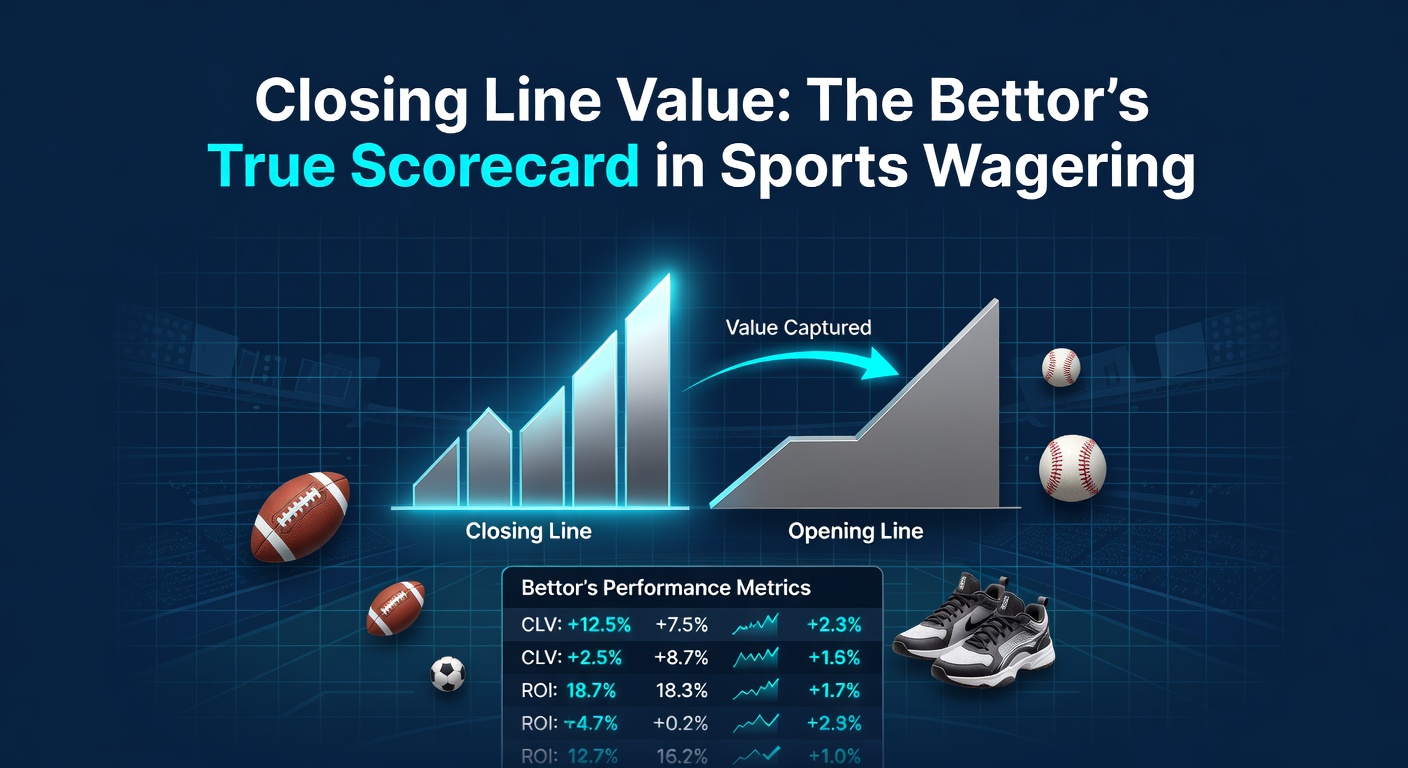
Closing Line Value: The Bettor's True Scorecard in Sports Wagering
Unpacking Closing Line Value in Sports Betting
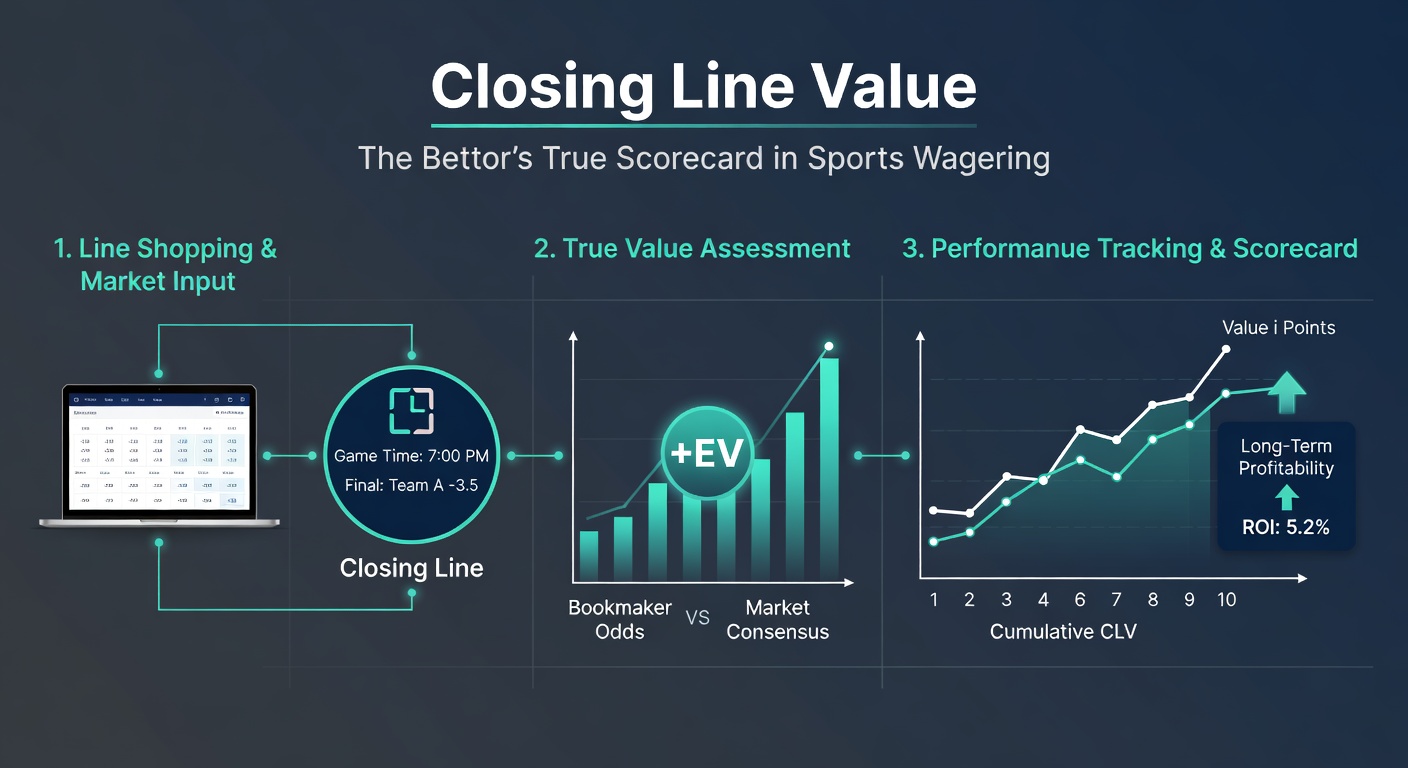
Closing Line Value, often shortened to CLV, stands as a key metric that bettors use to gauge their edge over sportsbooks, measuring the difference between the odds at which someone places a wager and teh final odds right before the event starts; this gap reveals whether a bettor secured better pricing than the market's ultimate consensus, and data from major leagues like the NFL and NBA shows that consistent positive CLV correlates strongly with long-term profitability, even if short-term results swing wildly.
Turns out, sportsbooks adjust lines based on sharp money and public action, so beating the close signals that a bettor anticipated those shifts correctly; researchers at the UNLV International Gaming Institute analyzed thousands of wagers across basketball seasons and found that bettors achieving positive CLV of 1% or more enjoyed win rates above break-even by margins that compounded over time, highlighting why pros track this over mere wins and losses.
But here's the thing: CLV doesn't care about the game's outcome, focusing instead on pricing efficiency, which separates recreational gamblers chasing hunches from those exploiting market inefficiencies; observers note how lines in high-profile events, say the Super Bowl, can move 2-3 points from open to close due to heavy professional action, rewarding those who jumped early.
Why CLV Trumps Traditional Win Rates
People often fixate on picking winners, yet experts emphasize that sports wagering thrives on value, not perfection; a bettor hitting 55% of picks at poor odds loses money long-term, whereas one at 52% with superior CLV turns profit because each wager extracts expected value from the line, and studies confirm this dynamic across sports from soccer to tennis.
Take NFL spreads: data indicates that lines close tighter as kickoff nears, incorporating late injuries or weather data that sharp bettors factor in sooner; those who've studied historical line movement report that positive CLV bettors outperform the market by 0.5-2% per bet on average, a edge that scales massively over hundreds of wagers, while negative CLV drags even high-win-rate players underwater.
What's interesting about this metric lies in its objectivity; it strips away variance from upsets or referee calls, offering a scorecard that sportsbooks themselves respect, since their models aim to balance action but can't always outpace informed bettors, and figures from Australian markets reveal similar patterns, where Australian Gambling Research Centre reports underscore CLV's role in sustainable betting practices amid growing legalized wagering Down Under.
Calculating CLV: Step-by-Step Breakdown
Bettors compute CLV by converting odds to implied probabilities, then comparing the original bet's price against the closing line; for a -110 American odds bet that closes at -130, the calculation shows positive value because the implied probability improved from 52.4% to 56.5%, yielding about 4% CLV, and tools like spreadsheets or apps automate this for volume tracking.
- Convert opening odds to no-vig probability using formulas that remove the bookmaker's juice.
- Repeat for closing odds, ensuring fair comparison.
- Subtract to find the percentage edge: positive means you beat the line, negative the reverse.
- Aggregate across bets for a portfolio CLV, ideally targeting 1-2% average for pros.
So, a simple example: someone bets Team A at +150 (40% implied) before it closes at +120 (45.5% implied), netting 5.5% CLV; researchers who've backtested this across MLB seasons discover that such edges compound, turning modest bankrolls into substantial returns over a year, although casual bettors overlook it amid chasing parlays.
And now, with April 2026's NBA playoffs heating up alongside the NFL Draft, lines fluctuate wildly on player props and futures; bettors tracking CLV here spot value in volatile markets like rookie over/unders, where early info on draft positions beats the close consistently.
Real-World Case Studies Across Sports
Consider a 2025 NFL divisional matchup where the opening spread sat at Packers -3, but sharp money pushed it to -5.5 at close; bettors who took the underdog at +3 banked 2.3% CLV regardless of the 27-24 Packers win, proving the metric's independence from results, and similar shifts occur in soccer's Premier League, where goals markets tighten post-team news.
There's this case from tennis Grand Slams: underdog players listed at +300 open but closing at +200 after public fades deliver 3-5% CLV to early backers; data from ATP events shows pros averaging positive CLV in 60% of sessions, fueling their edge, while NBA totals offer another arena, with lines moving half a point on average due to pace projections.
Yet pitfalls emerge: reverse line movement, where lines defy public betting, signals pro action and boosts CLV for contrarians; one study of NHL puck lines revealed that tracking this alone lifted profitability by 12% over naive strategies, underscoring why seasoned bettors log every wager meticulously.
Tools, Strategies, and Common Traps
Bettors leverage apps like Bet Labs or custom Excel sheets to monitor CLV in real-time, integrating APIs from books for automated pulls; strategies focus on shopping lines across multiple sportsbooks to maximize initial value, since even a 5-cent difference compounds, and those who do this report portfolio CLV jumping 0.8% on average.
But here's where it gets tricky: steam chasing, or betting lines post-move, erodes CLV because late prices reflect the wisdom already, leaving juice-heavy odds; experts observe that limiting volume to high-confidence spots preserves edge, especially in props where books lag on niche stats.
Common traps include ignoring vig in calculations or sample size illusions from hot streaks; figures show it takes 500+ bets for CLV stats to stabilize, so patient trackers outperform impulsive ones, and in emerging markets like esports, volatile lines amplify CLV opportunities for those ahead of the curve.
- Shop 5+ books per bet for best open prices.
- Focus on sports with frequent line movement, like NFL and NBA.
- Avoid parlays; they dilute CLV through multiplied vig.
- Review monthly: aim for >0.5% average, adjust accordingly.
Conclusion
Closing Line Value emerges as the unvarnished truth serum for sports wagering success, distilling raw pricing skill from outcome noise; bettors embracing it shift from gamblers to investors, as evidenced by pros who sustain edges year after year, and with legalized betting expanding globally, tools and data make CLV accessible like never before.
Now, as April 2026 brings NBA postseason frenzy and NFL offseason bets, those tracking CLV position themselves best; the reality is, beating the close isn't luck, it's the scorecard that counts, rewarding discipline over dazzle every time.