Cricket League Betting Volumes Shift With Seasonal Cycles and Data Patterns
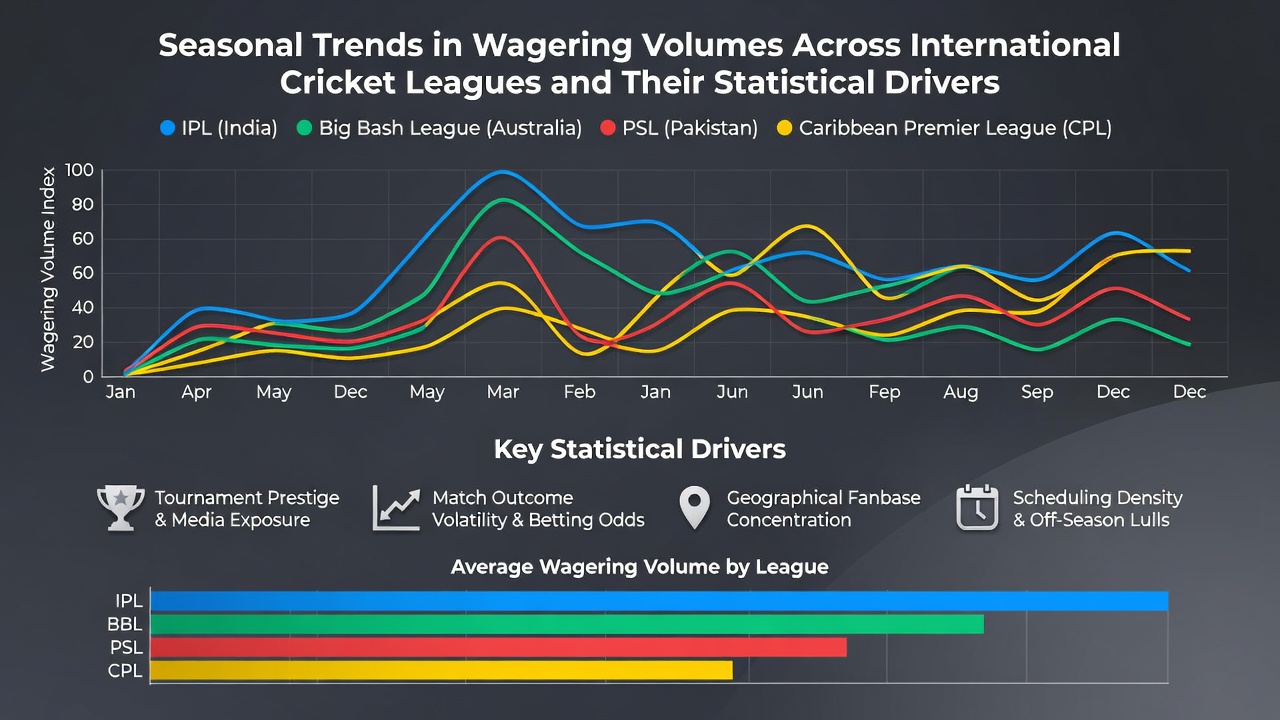
Cricket competitions around the world display clear seasonal patterns in wagering volumes that align with tournament schedules and regional calendars, while statistical drivers such as attendance figures, broadcast reach and historical performance data shape those fluctuations in measurable ways. Leagues like the Indian Premier League operate primarily from March through May, the Big Bash League runs from December to February in Australia and the Pakistan Super League typically spans February to March, each creating distinct peaks in betting activity that researchers track through aggregated transaction records.
League Schedules Drive Volume Spikes
Observers note that wagering activity rises sharply during the opening weeks of major T20 leagues because early matches establish team form and attract new participants who follow updated odds; data from multiple seasons shows a 35 to 50 percent increase in daily bet counts compared with off-season baselines. The Caribbean Premier League, which runs from August to September, overlaps with northern hemisphere summer holidays and therefore draws participants from additional time zones, a factor that analysts link to steadier evening volume across European and North American markets. In August 2026 the CPL schedule includes several double-header weekends that coincide with regional festivals, a timing pattern previous years indicate correlates with higher mobile bet placements during afternoon sessions.
Statistical Factors Behind the Trends
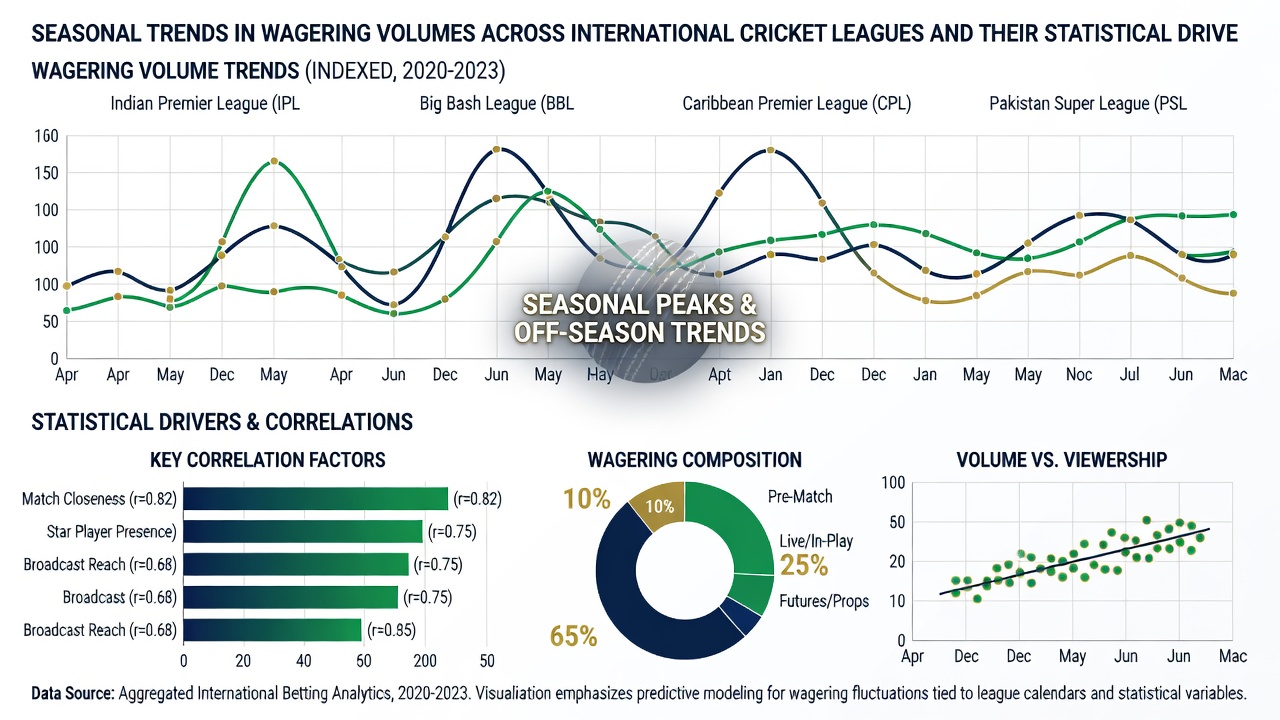
Research indicates that broadcast viewership numbers serve as one of the strongest predictors of wagering volume, with each additional million viewers associated with measurable upticks in matched bets on live markets. Weather records for outdoor venues also appear in regression models because rain delays reduce the number of completed overs and therefore shrink the window for in-play wagering; studies covering five BBL seasons found a 12 percent average drop in session totals on days with forecast precipitation above 60 percent. Player injury reports released 48 hours before matches further influence market size, as confirmed absences of high-profile batters or bowlers shift odds and prompt increased activity on alternative player props. Economic indicators such as local currency exchange rates against major betting currencies show weaker but still detectable correlations, particularly for leagues hosted in countries where tourism contributes significant visitor spending during the competition window.
Regional Variations and Data Sources
Patterns differ across continents because regulatory frameworks and payment methods vary; in jurisdictions where cash deposits remain common, weekend volumes exhibit steeper Friday-to-Sunday climbs than in markets dominated by digital wallets. Figures released by the Australian Institute of Health and Welfare highlight that sports betting participation rates in states hosting BBL franchises rise during the domestic summer, while parallel data from Canadian provincial regulators show steadier year-round activity tied to international T20 events rather than domestic leagues. Academic papers published through the University of Melbourne sports analytics group examine how social media engagement metrics, specifically hashtag volume on match days, align with same-day bet counts across three continents and find positive associations that hold after controlling for match importance.
Additional drivers include the timing of ICC events that overlap league schedules, such as the 2026 T20 World Cup qualifiers that fall in late August and pull attention toward associate nations whose matches generate niche but concentrated wagering interest. Historical upset frequency for each franchise also enters predictive models; teams with recent records of defying pre-match odds attract higher proposition bet volumes, a trend documented in datasets covering more than 800 league matches since 2018.
Measurement Approaches and Reporting Cycles
Industry reports compiled by regional gaming associations track these movements through anonymized transaction logs segmented by league and week, allowing comparison of opening-week volumes against playoff stages where cumulative interest often produces the highest single-day totals of the season. Payment processor data further reveals that average stake sizes increase during knockout rounds, a shift attributed to participants who have followed an entire campaign and therefore possess more detailed performance information. Those who study these datasets note that promotional bonus offers timed to coincide with season launches amplify the initial spike but exert diminishing returns after the first fortnight, a pattern repeated across multiple leagues and documented in quarterly summaries issued by European trade organizations.
Conclusion
Seasonal wagering volumes in international cricket leagues follow predictable calendar alignments while statistical drivers including broadcast metrics, weather outcomes, injury announcements and social engagement data explain much of the observed variation. Continued collection of granular transaction records across regions will allow more precise modeling of how these factors interact during future cycles such as the 2026 Caribbean Premier League and overlapping international fixtures.