Decoding the Algorithms That Shift Live Odds in Professional Sports
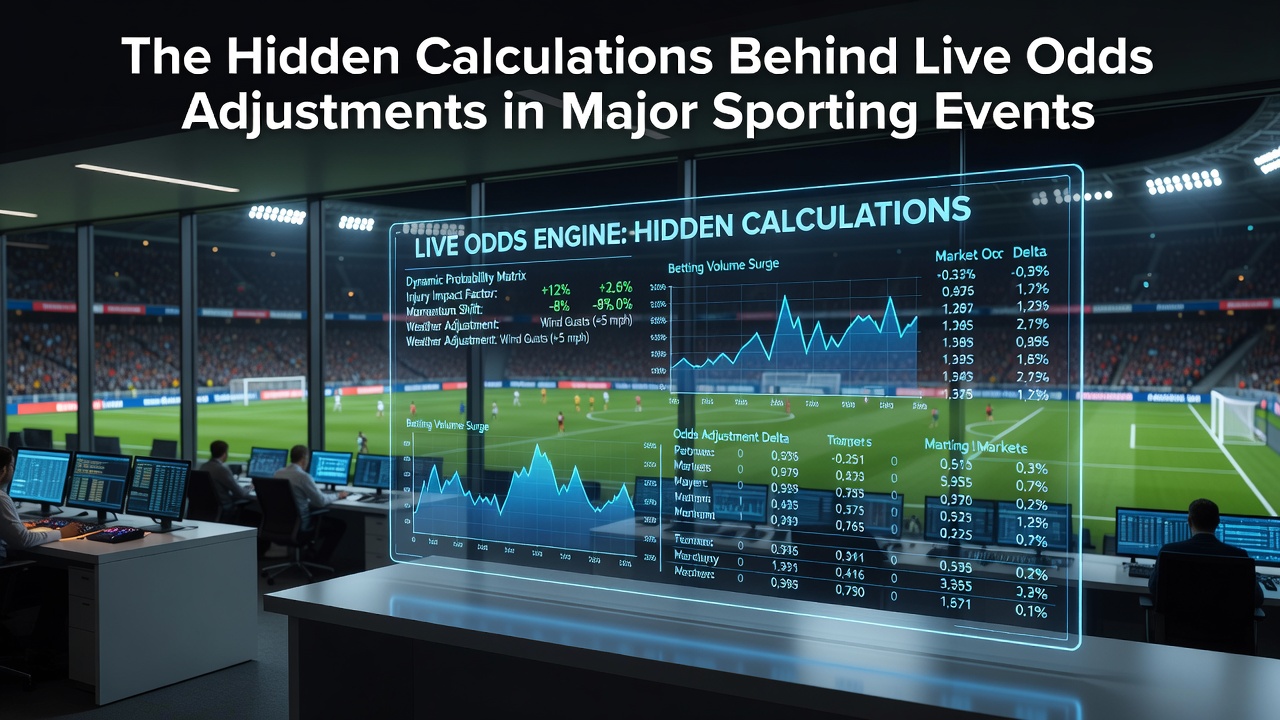
Bookmakers rely on layered computational models that process incoming match data every few seconds, and these systems recalculate probabilities across thousands of betting markets while incorporating player statistics, weather conditions, and historical performance trends. The adjustments reflect not only the immediate score but also shifts in expected value derived from Poisson distributions for goal scoring and regression analyses that weight recent form against long-term averages. Observers note that such calculations maintain the bookmaker margin, often between 2 and 5 percent, even as odds fluctuate.
Core Data Streams Feeding the Models
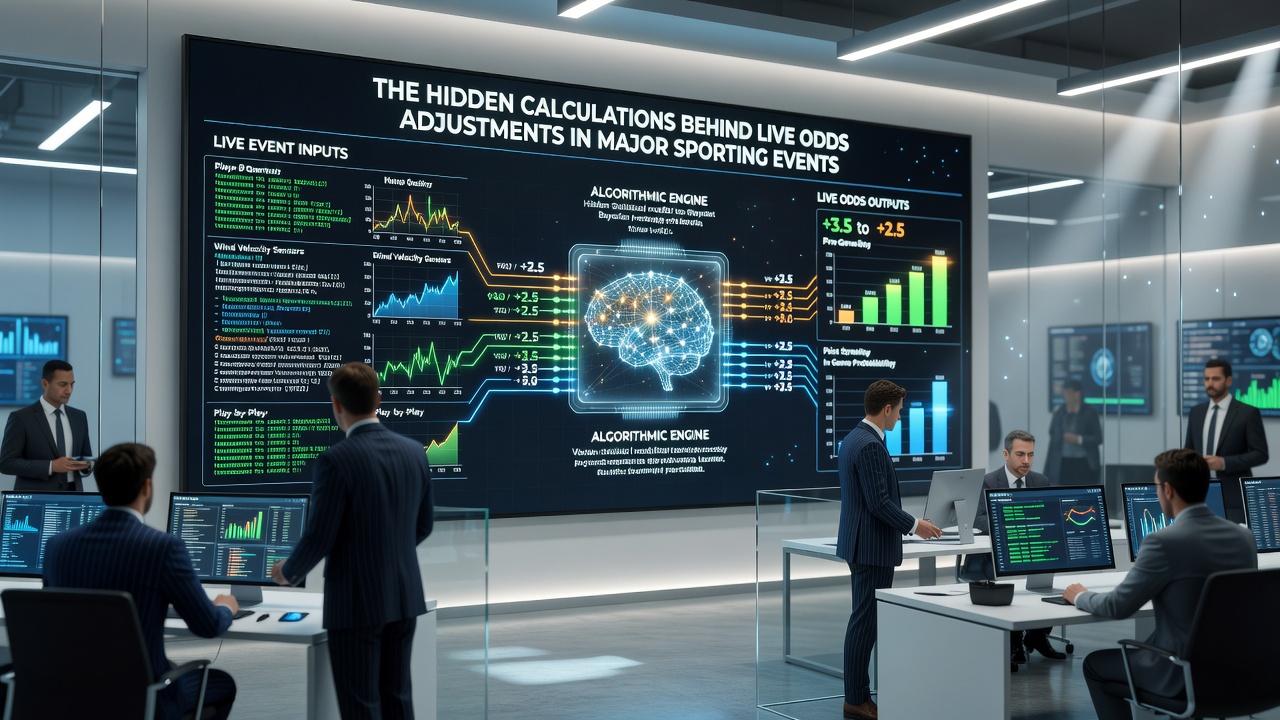
Real-time inputs arrive from multiple sources including optical tracking systems installed in stadiums, wearable sensors on athletes, and external feeds that track ball velocity plus player positioning, and these streams combine with pre-match baselines stored in proprietary databases. Analysts at major operators integrate variables such as fatigue metrics calculated from distance covered and heart rate data when available, while machine learning layers update expected goals or points scored every time a possession changes hands. Research from sports analytics groups shows that incorporating second-by-second location data improves prediction accuracy by up to 15 percent compared with models limited to box-score summaries alone.
Probability Recalculation Mechanics
Once fresh information enters the system, algorithms apply Bayesian updating to revise outcome probabilities, and this process multiplies prior distributions by likelihood functions derived from the latest events before normalizing the results into new odds. For instance in football, a sudden red card triggers an immediate reweighting that lowers the penalized team win probability while boosting draw and opponent win chances, yet the adjustment also accounts for time remaining and current score differential through time-decay functions. In basketball, three-point shooting variance models adjust dynamically after a hot streak because clustering analysis identifies whether the sequence exceeds random expectation. Experts have observed that these updates occur in under 500 milliseconds to prevent arbitrage opportunities across competing platforms.
Risk Management Layers and Margin Protection
Behind the visible odds sit exposure limits that cap total liability on any single outcome, and automated systems scale stakes or suspend markets when aggregate bets approach those thresholds. Traders monitor sharp money movements that signal potential information advantages, then widen spreads or shade lines accordingly while preserving the overall hold percentage. Figures from industry reports indicate that operators handling major events such as the Olympics or World Cup finals adjust thousands of markets simultaneously, and the balancing act prevents large payouts from concentrated positions. Data compiled through 2025 demonstrates that sophisticated hedging through exchange markets further stabilizes the books when live imbalances emerge.
Case Examples From Recent Competitions
During high-profile tennis matches in 2025, serve-speed deviations and unforced error rates triggered rapid shifts in game-win probabilities that propagated to set and match odds within seconds, and similar patterns appeared in rugby where scrum penalties altered territory expectations. In August 2026 projections for upcoming international tournaments, enhanced sensor networks are expected to supply even finer-grained fatigue indicators that further tighten adjustment intervals. One study examining European football leagues found that live models incorporating pass-completion heat maps outperformed simpler score-only versions by reducing mean squared error in predicted results. Those patterns illustrate how granular inputs translate into visible price movements that bettors encounter on their screens.
Regulatory Oversight and Transparency Requirements
Government agencies such as the Nevada Gaming Control Board and the Australian Competition and Consumer Commission require operators to maintain auditable records of odds-setting methodologies, and these rules ensure that adjustments remain consistent with disclosed algorithms rather than arbitrary interventions. Academic papers published in journals focused on computational statistics have examined the statistical properties of live odds sequences, revealing that efficient markets incorporate new information rapidly yet still embed the house edge. Industry associations including the European Gaming and Betting Association publish guidelines on responsible market operation that reference the same modeling techniques used by compliance teams.
Conclusion
The interplay of sensor data, statistical distributions, and exposure controls produces the fluid odds that characterize modern live betting environments, and continued advances in sensor technology plus algorithmic sophistication promise even faster recalibrations in future seasons. Observers tracking these systems note that the underlying mathematics remain grounded in established probability frameworks even as implementation grows more intricate.