How Sporting Calendars Shape Activity Levels Across Digital Wagering Platforms
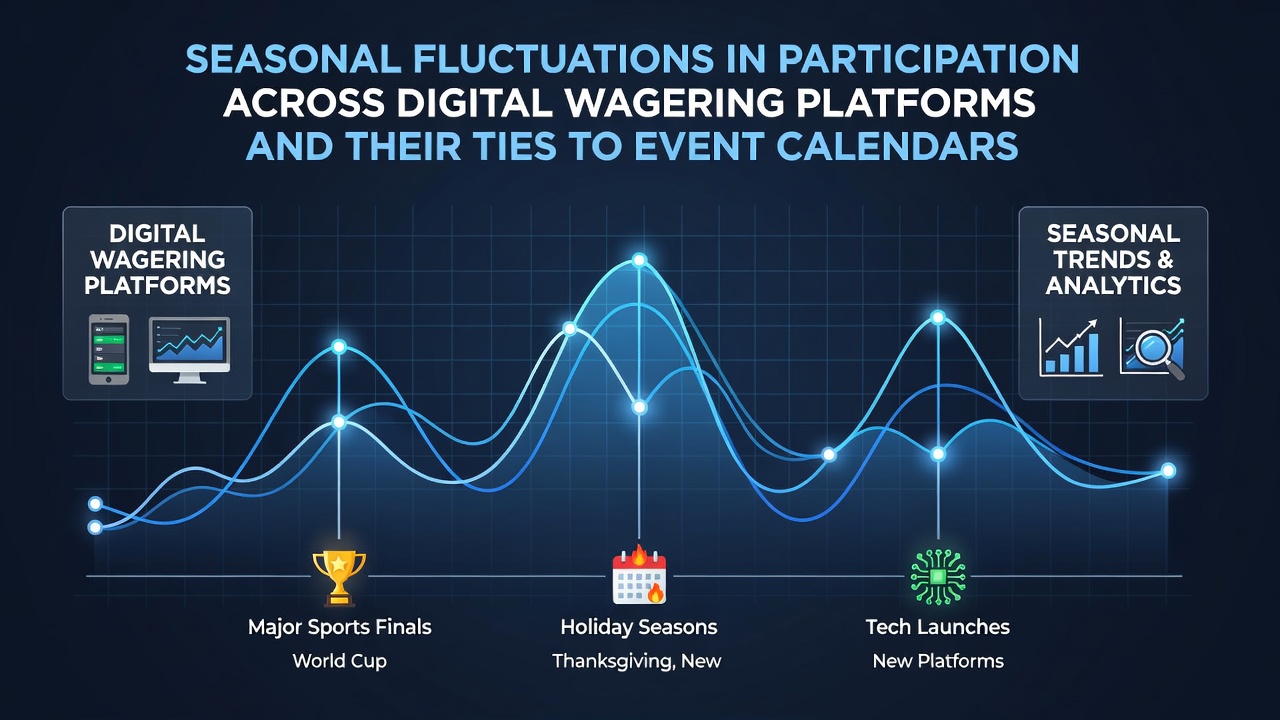
Digital wagering platforms experience measurable shifts in user participation that align closely with annual sports schedules and major event timings, and researchers track these patterns through aggregated platform data across multiple regions. Participation tends to rise during periods when high-profile competitions dominate public attention, while quieter months see corresponding declines that follow predictable cycles tied to league seasons and international tournaments.
Alignment With Professional League Seasons
Football leagues across Europe and North America provide one of the clearest examples of this connection, since their start dates and fixture lists directly correlate with increased login volumes and bet placements on operator sites. Data shows activity climbing sharply once pre-season fixtures give way to competitive matches, and August stands out as a notable transition point in many markets. In August 2026, several top European divisions will resume full schedules, creating overlapping windows with North American baseball playoffs and early preparations for gridiron seasons that analysts expect to drive similar upticks in engagement metrics.
Observers note that these calendar-driven surges appear consistently year after year, because fans adjust their routines around match days and integrate betting into their viewing habits. Yet participation does not remain uniformly elevated throughout an entire season, since mid-season lulls and international breaks often produce temporary dips that platforms anticipate and plan for through targeted promotions.
Impact of International Tournaments and Playoffs
Global events such as the FIFA World Cup and continental championships generate even more pronounced spikes, because they compress high-stakes matches into short periods that capture attention from casual participants who rarely engage outside these windows. Studies from academic institutions in Australia have documented how these concentrated calendars produce participation rates that can exceed baseline figures by substantial margins during group stages and knockout rounds. The same pattern holds for basketball and ice hockey postseason runs, where elimination formats keep interest levels elevated until championships conclude.
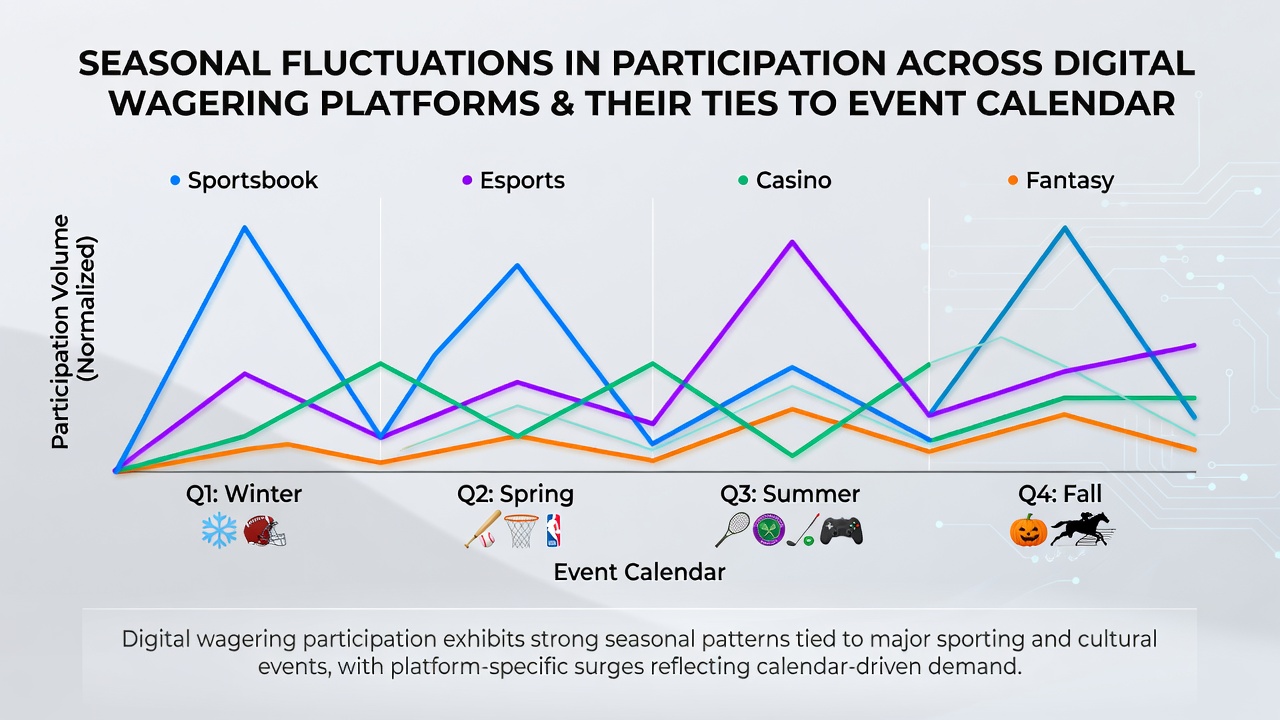
Platform operators adjust server capacity and marketing calendars accordingly, since historical records indicate that these events create short but intense demand periods rather than steady year-round growth. What's interesting is how secondary sports sometimes benefit from spillover when primary events overlap, allowing users to maintain activity levels across multiple categories without requiring entirely new user acquisition.
Regional Variations and Regulatory Context
Differences emerge when comparing markets with distinct regulatory frameworks, because availability of certain event types influences which calendars drive the strongest responses. In North America, data from the Nevada Gaming Control Board highlights how American football schedules produce the largest annual swings, whereas European operators report more balanced contributions from football, tennis, and racing circuits. Australian researchers have similarly mapped how horse racing carnivals and cricket seasons create localized peaks that operators now incorporate into forecasting models.
These regional distinctions matter because they affect how platforms allocate resources for customer support and risk management during peak windows. A single overlapping period, such as the convergence of summer Olympics qualification events with domestic league restarts, can strain systems if operators fail to account for the combined calendar pressure.
Longer-Term Trends and Data Tracking
Longitudinal analyses reveal that while individual events create sharp but temporary changes, the overall rhythm of participation follows broader annual patterns that repeat with high reliability. Industry reports compiled by groups like the European Gaming and Betting Association track these cycles through anonymized transaction volumes, confirming that holiday periods and off-seasons produce the most noticeable troughs outside of major disruptions. Platforms use this information to refine staffing, bonus structures, and content delivery so that quieter months receive different treatment than high-activity stretches.
Technology improvements in real-time analytics now allow more precise mapping of these fluctuations, enabling operators to correlate specific fixture lists with user behavior at granular levels. This approach supports better planning for August 2026 and future seasons, since historical datasets provide reliable baselines for expected volume changes tied to confirmed event dates.
Conclusion
Seasonal fluctuations in digital wagering participation remain tightly linked to the structure of sporting calendars, and ongoing data collection continues to refine understanding of these relationships across different markets. Platforms that monitor these patterns through established regulatory and academic channels can align their operations more closely with predictable demand cycles, resulting in more stable service delivery throughout the year.