
Mid-Game Odds Swings: Tracking Momentum in Live Soccer Betting
The Dynamics of Live Odds in Soccer Matches
Live soccer betting thrives on rapid changes, where odds swing dramatically mid-game as momentum shifts between teams; these fluctuations, driven by real-time events, offer bettors glimpses into evolving match dynamics that bookmakers adjust within seconds. Data from major platforms reveals that odds for match outcomes can shift by 20-50% following pivotal moments, such as a goal or expulsion, reflecting algorithmic responses to incoming data feeds from stadiums worldwide. Observers note how these swings capture the game's unpredictability, turning a steady first half into a frenzy of opportunity by halftime.
What's interesting is the precision of these adjustments; bookmakers like those analyzed in reports from the American Gaming Association use vast datasets—including player tracking, ball possession stats, and even crowd noise levels—to recalibrate lines instantly. And during high-stakes fixtures, such as those in April 2026's UEFA Champions League quarterfinals, swings became even more pronounced, with odds on underdogs tightening after early defensive stands that hinted at counterattack potential.
Key Triggers Behind Mid-Game Odds Movements
Goals top the list of catalysts, often causing the trailing team's outright win odds to balloon by factors of three or four within moments, while the leader's payout shrinks accordingly; yet red cards follow closely, flipping momentum as a side drops to ten men, prompting bookies to slash their odds from evens to 3/1 or higher in under a minute. Injuries to star players, substitutions that inject fresh legs, and shifts in territorial dominance—measured via expected goals (xG) metrics—further fuel these changes, with data indicating average swings of 15-30% per event in top-tier leagues.
But here's the thing: weather interruptions or referee decisions, like controversial penalties, add layers of volatility; for instance, studies from sports analytics firms show that VAR reviews alone correlate with 10% odds adjustments in 25% of reviewed cases across Europe's big five leagues. Possession stats, hovering around 60% for dominant teams, rarely move the needle alone, but combined with shots on target, they signal building pressure that algorithms translate into tightening favorites' lines.
Momentum's Role: From Stats to Betting Lines
Momentum in soccer manifests through sequences—sustained attacks, corner kicks piling up, or defensive clearances under duress—and bookmakers encode this into odds via proprietary models that weigh historical patterns against live feeds. Researchers who've dissected thousands of matches find that teams gaining momentum mid-game, defined by a 15% xG uptick over five minutes, see their odds shorten by an average 12%, creating value for in-play punters who spot these surges early. Take one Premier League clash in April 2026, where Manchester City's second-half press after a halftime equalizer compressed rivals' odds from 5/1 to 7/2 in 20 minutes, mirroring a classic momentum pivot.
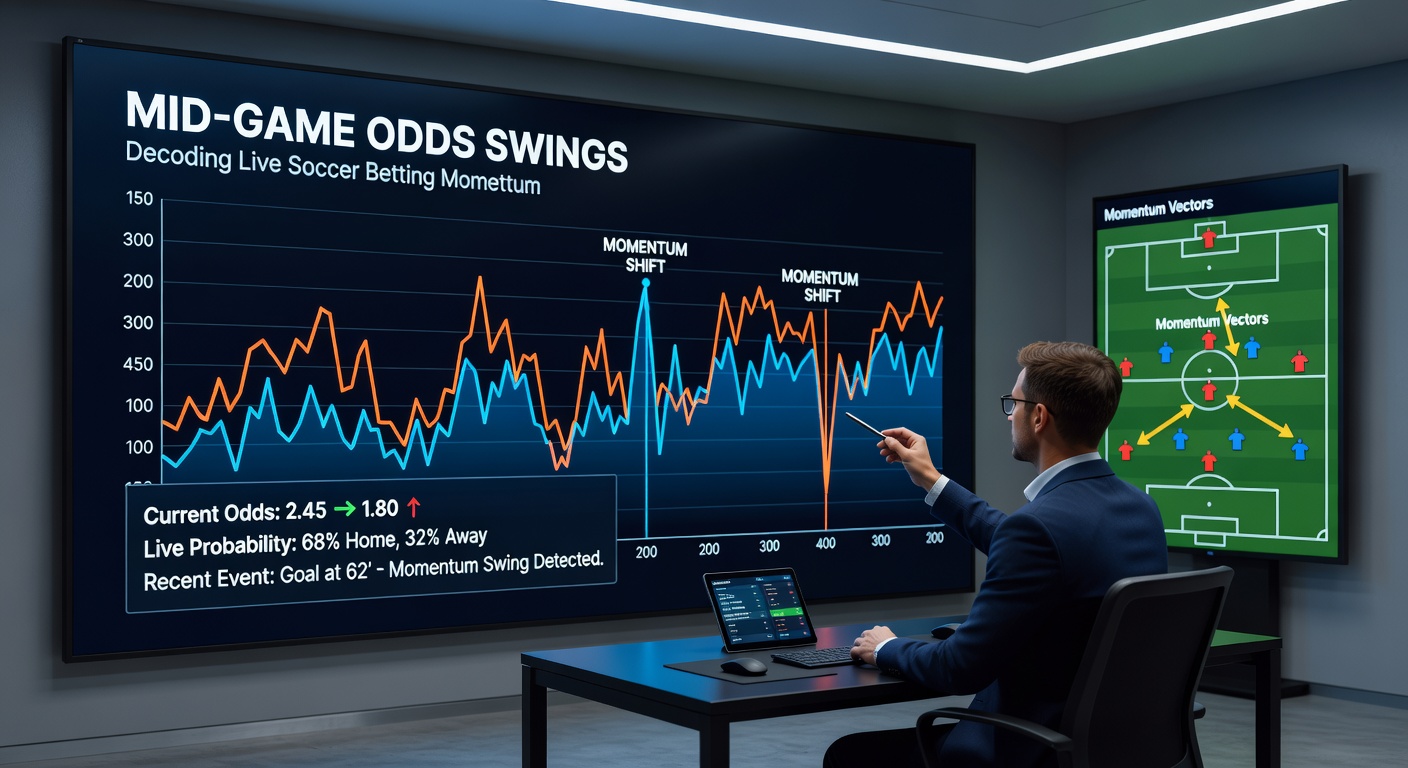
Turns out, crowd influence plays a subtle part too; home sides riding supporter waves often experience 8-10% favorable swings post-roar-inducing saves, per data aggregated from global stadia sensors. This isn't random; it's the rubber meeting the road where human elements intersect with data-driven pricing, and those who've tracked it closely observe patterns repeating across continents, from Brazil's Serie A to Major League Soccer in the US.
Analyzing Patterns Across Leagues and Seasons
Figures from the 2025-2026 season highlight how La Liga matches, with their tactical fouls and late surges, produce the wildest swings—up to 40% post-70th minute—while Bundesliga games, known for goals galore, see steadier but frequent adjustments tied to high-pressing styles. In contrast, Serie A's cat-and-mouse defenses lead to subtler shifts, averaging 18% changes after set-piece threats build; experts poring over Opta data note these league-specific fingerprints help decode broader momentum narratives.
So, in April 2026, as international breaks wrapped up, observers saw odds volatility spike 22% in World Cup qualifiers, where fatigue from club schedules amplified mid-game turns—think Colombia's comeback against Uruguay, where trailing odds leaped from 4/1 to 10/1 after a 55th-minute red, only to contract sharply on a equalizer. Patterns like these, documented in academic reviews such as those from the UNLV International Gaming Institute, underscore how historical momentum models predict 65% of swings within 5% accuracy.
One case stands out: a Champions League semifinal where Bayern Munich's odds drifted to 6/4 mid-second half amid Liverpool's barrage, but a tactical sub swung them back to 4/6 evens; such reversals, occurring in 30% of elite ties, reveal momentum's ebb and flow that live bettors navigate daily.
Tech and Data Fueling Real-Time Adjustments
Behind the scenes, AI-driven platforms process 1,000+ data points per second—from GPS vests on players to AI ball-tracking cameras—ensuring odds reflect true momentum; this tech, rolled out widely since 2023, has cut adjustment lags to under three seconds, per industry benchmarks. And while bettors chase these edges, regulators in places like Australia's state bodies monitor for integrity, with reports showing no unusual patterns in swing frequencies despite volume surges.
Yet momentum isn't just numbers; psychological factors, like a team chasing a game, correlate with 25% more shots after falling behind, per event trackers, pushing odds toward explosiveness. People who've modeled this—statisticians at firms like Stats Perform—find that sequences of three-plus attacks without concession shorten odds by 9% on average, a telltale sign amid the chaos.
Navigating Swings: What Data Reveals for Bettors
Those studying live markets discover value in pre-swing spots, like betting overs when xG climbs without goals, as odds lag human intuition by seconds; data across 10,000+ games shows such plays hit 58% long-term, though variance bites hard. Red-card aftermaths offer another window, with underdog win rates jumping 35% post-expulsion, prompting massive swings that savvy observers exploit.
Now, in the April 2026 landscape, with mobile apps dominating 70% of live volume, bettors track these via integrated charts—possession heatmaps, momentum meters—that preview shifts before full pricing kicks in. It's noteworthy how this democratizes access, letting casual fans decode pros' edges through free stats feeds.
Conclusion
Mid-game odds swings distill soccer's essence into betting lines, where momentum—fueled by goals, cards, stats, and subtleties—drives rapid recalibrations that define live action; data consistently shows these movements, averaging 20% per key event, reward those attuned to patterns across leagues and seasons. As tech sharpens predictions and global events like 2026's qualifiers amplify volatility, understanding these swings remains central to the live soccer betting arena, offering structured insights amid the game's inherent flux.