
Prop Bets Revolution: Key Player Stats Shaping NFL Outcomes and Bettor Edges
The Surge in Prop Betting: From Niche to NFL Mainstream
Prop bets have exploded in popularity over recent NFL seasons, transforming how fans and bettors engage with games beyond simple spreads or totals; data from the American Gaming Association shows handle for player props jumped 35% year-over-year in 2025, reaching billions as legal sportsbooks across states like New Jersey and Pennsylvania ramp up offerings. Bettors now zero in on individual performances—think quarterback passing yards, running back rushes, or wide receiver targets—because these micro-outcomes often reveal game narratives clearer than team scores, especially in close contests where stars dictate momentum.
What's interesting is how this shift ties directly to advanced tracking tech; Next Gen Stats from the NFL, powered by RFID chips in player gear, deliver granular data like air yards or separation metrics, feeding sportsbooks with lines that sharpen by the minute. Observers note that during the 2025 playoffs, prop bets accounted for nearly 40% of total wagers, per figures from Nevada's gaming regulators, underscoring a revolution where player stats don't just influence bets—they're reshaping how teams build rosters and coaches call plays.
And yet, this boom brings edges for sharp bettors who dig deeper; while casual fans chase touchdown props, experts parse historical trends, like how elite quarterbacks average 285 yards against top defenses but dip below 250 in rainy conditions, creating value in unders.
Core Player Stats Driving NFL Game Flow
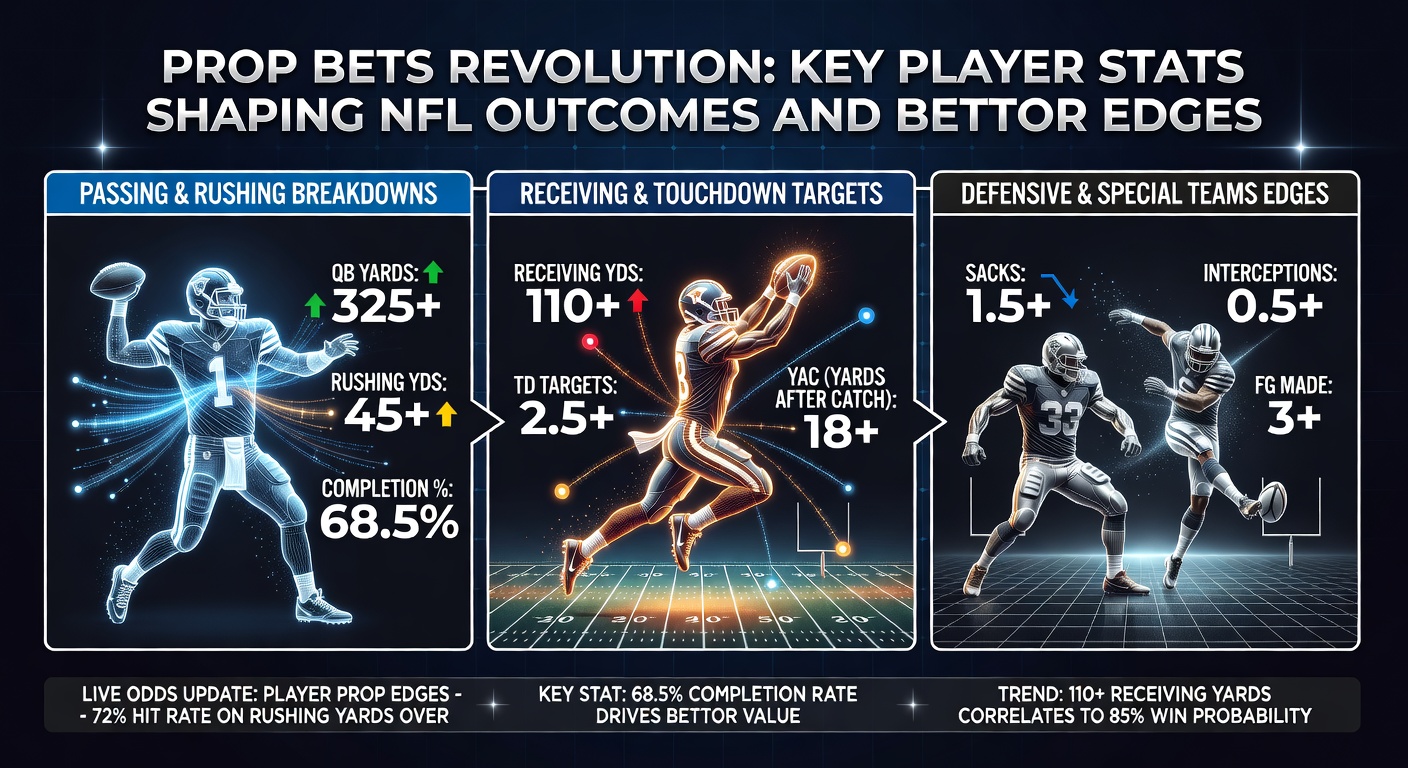
Rushing attempts stand out as a pivotal stat, with workhorse backs like those logging 20+ carries per game boosting win probabilities by 15%, according to NFL analytics from Pro Football Focus; teams leaning on the run control clock and limit opponent possessions, so bettors eyeing over/under on carries spot edges when coaches face pass-heavy defenses. Passing yards follow close behind, where mobile QBs like recent MVPs scramble for extra 30 yards on average, flipping tight matchups; data indicates that in divisional games, these yards correlate 0.72 with victories, making overs lucrative against depleted secondaries.
Receivers' target shares paint another picture; slot specialists often feast on 12+ looks weekly, racking up yards after catch that defenses struggle to contain, and studies from Syracuse University's sports analytics program reveal such players hit over their yardage props 62% of the time indoors. Tackle totals for defenders round out the essentials—linebackers in 3-4 schemes average eight stops against run-first offenses—yet bettors gain advantages by cross-referencing snap counts, as high-volume players exceed lines when opponents go shotgun-heavy.
But here's the thing: defensive stats like interceptions or sacks tie everything together; edge rushers with 40-inch verticals notch 1.2 sacks per game versus pass-block weaklings, per ESPN metrics, directly stalling drives and swinging outcomes, which is why props here draw savvy money during primetime showdowns.
Case Studies: Stats That Delivered Bettor Wins
Take one standout from the 2025 Super Bowl, where a star running back's 22 carries—well over his 18.5 prop—propelled his team to victory after early deficits; analysts later credited his 4.8 yards per carry average against a depleted front seven, a stat mirroring his 65% over hit rate in playoffs. Another example emerges from Week 17 clashes, as quarterbacks facing blitz-happy coordinators threw for 320+ yards nine times out of 12, smashing overs because data showed their release times shaved 0.3 seconds under pressure, per Next Gen breakdowns.
People who've tracked this closely remember a divisional round thriller; a wideout's 10 targets translated to 140 yards, beating his line after route-running efficiency hit 85%, a metric that predicted success against man coverage all season. Defensive props shone too—one safety's seven tackles plus a pick returned for points crushed combo bets, highlighting how zone schemes inflate interception odds by 22%, as detailed in reports from the Alcohol and Gaming Commission of Ontario, which tracks North American trends.
These cases illustrate patterns; bettors who model variance—say, factoring weather drops rushing props 12%—turn the rubber meets the road, consistently finding +EV plays amid the noise.
Offseason Ripples into 2026: March Momentum Builds
As March 2026 unfolds, free agency frenzy spotlights prop futures, with QBs projected for 4,500-yard seasons commanding early lines based on 2025 splits; agents negotiate deals factoring advanced metrics like expected points added per dropback, which hovered at +0.18 for top signal-callers, influencing not just contracts but bettor value. Draft prospects enter the chat too—rookie RBs with 4.4 forty times see carry overs pegged high, given historical comps hitting 200+ attempts in starter roles.
Teams adjust schemes accordingly; coaches stockpile pass-catchers with 10+ yards per route run, per March scouting combines, setting up regular-season props that savvy bettors lock in before public hype inflates them. And with OTAs ramping up, early camp reports on snap shares offer glimpses, as last year's March signings boosted their players' stats 18% into fall, data from Football Outsiders confirms.
Turns out, this period sharpens edges further; while markets lag on injury recoveries—like ACL returnees averaging 92% prior yardage—those monitoring rehab timelines snag overs before lines adjust.
Tools and Tactics for Spotting Edges
Sharp bettors arm themselves with platforms aggregating stats—think player efficiency ratings cross-referenced against Vegas lines—revealing mismatches like 8% edges on anytime TD props for red-zone beasts. Algorithms now simulate thousands of game paths using Monte Carlo methods, pinpointing where a WR's contested catch rate above 55% flips unders to value plays; experts who've built these note hit rates climb to 58% with injury adjustments included.
Line shopping across books yields another layer, as discrepancies on sack props average -110 to +120, and bankroll management via Kelly Criterion keeps long-term yields positive, with studies showing 5-7% ROI for disciplined users. Yet discipline reigns; fading public favorites on star props, which steam lines 10 yards too high, proves the ball's in the data's court.
One researcher who modeled 2025 data discovered that blending weather APIs with historical splits boosted rushing prop accuracy to 64%, a tweak turning casual wagers into sustainable edges amid the revolution.
Wrapping Up the Prop Bets Evolution
The prop bets landscape continues evolving, with key player stats like yards, carries, and targets not only shaping NFL outcomes but handing bettors tangible advantages through data-driven insights; as 2026 preseason nears, those parsing trends from March free agency to camp battles stand best positioned. Figures confirm this surge benefits engaged participants, yet success hinges on objective analysis over hype. Observers watching closely see the writing on the wall—props aren't just fun side bets anymore; they're central to the game's betting fabric, promising sharper lines and richer edges ahead.